
System Performance Metrics Every Engineer Should Know: QPS, TPS, Concurrency, Response Time
A practical guide to the four metrics that explain why your API feels slow, plus a tiny demo API implemented across popular stacks with real measurement queries.
"It's slow" is not a bug report
A customer might say checkout "spins" for 6 seconds.
Someone might say "add more servers."
Someone else might say "the database is fine."
Someone else might say "works on my machine."
It's like when the replicators on the Enterprise stop working and everyone's guessing—power conduits, plasma relays, maybe the Heisenberg compensators. Turns out they're just full of tribbles. You can't fix performance by guessing; you need to check the diagnostic sensors. None of that matters until you can answer:
- What's the p95 response time under load?
- What's the current concurrency at peak?
- How many requests are we actually receiving (QPS)?
- How many real business operations are we completing (TPS)?
You can fix performance with feelings, but it's expensive and it doesn't scale. It's like trying to navigate by asking strangers on the street instead of checking your GPS. The GPS might not always be right, but at least it's giving you actual coordinates.

What these metrics are (student-friendly)
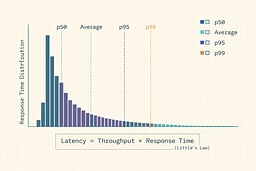
Response Time (RT)
RT is how long a request takes from start to finish. Think of it like the time between when you press the elevator button and when the doors open. Track percentiles because "average" hides pain. Averages can look fine while a small chunk of requests are awful—like saying the average temperature in a room is comfortable when half the room is freezing and the other half is on fire.
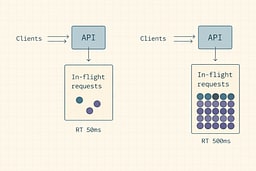
Concurrency
Concurrency is how many requests are being processed at the same time. It's like the number of people currently in the elevator shaft—not waiting in line, but actually in transit. If requests take longer, concurrency rises even if QPS stays flat. It's the difference between a fast elevator that clears quickly and a slow one where people stack up inside.
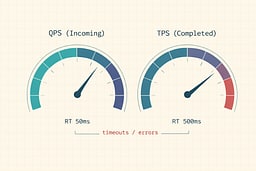
Queries Per Second (QPS)
QPS is incoming pressure. It's the rate your system is being asked to do things. Think of it as how many people are pressing the elevator button per second. It doesn't tell you if they're getting where they need to go, just how many are trying.
Transactions Per Second (TPS)
TPS is completed work. One "transaction" should represent something meaningful: "checkout completed," "order created," "profile updated." It's the difference between button presses and actual elevator rides. QPS can be high while TPS is low if you're timing out, failing, or stuck—like an elevator that accepts button presses but never actually moves.
The one relationship you should tattoo on your monitoring dashboard
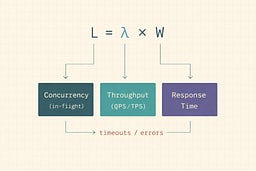
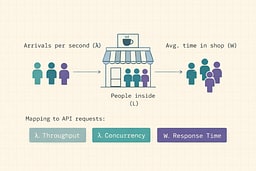
Little's Law (queueing theory) says:
L = λ × W
Where:
- L = average number of things in the system (concurrency / in-flight)
- λ = average arrival or completion rate (throughput, often QPS or TPS depending on your boundary)
- W = average time in the system (response time)
This isn't some theoretical abstraction. It's the mathematical relationship that explains why your system falls over. If you understand this formula, you understand performance. If you don't, you're flying blind.
Practical translation:
- If your p95 latency doubles and QPS is steady, your system needs roughly 2× concurrency capacity to cope.
- If your concurrency limit is fixed (threads, connections, CPU), latency "runs away." It's like a traffic jam that gets worse the longer it lasts.
The coffee shop metaphor helps: if people arrive at rate λ (arrivals per minute), spend W minutes inside, then L = λ × W people are in the shop at any moment. If the barista slows down (W increases), more people stack up inside (L increases) even if the arrival rate stays the same.
Alternatives (and why they're not enough alone)
Before we dive deeper, let's address the elephant in the room: why not just use what you already have?
-
CPU, memory, disk, network (resource metrics)
Useful, but they don't tell you what users feel. Your CPU might be at 50%, but if your p95 latency is 5 seconds, users are still having a bad time. Resource metrics are like checking the engine temperature when the car won't start—relevant, but not the whole story. -
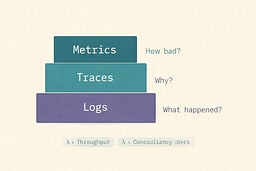
APM traces only
Traces are great for "why," but you still need the top-line numbers to know "how bad" and "is it getting worse." Traces tell you which function call is slow. Metrics tell you if the entire system is on fire. -
Logs
Logs are forensic evidence. Metrics are the smoke alarm. By the time you're reading logs to understand performance, the building is already on fire.
This article is about the smoke alarm.
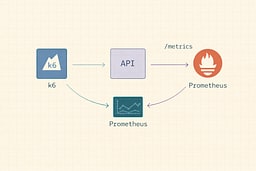
The demo API we'll measure in multiple languages
We'll implement the same tiny API everywhere. This isn't a production-ready service—it's a teaching tool. Think of it as a skeleton that shows you where the bones go. You can add muscle later.
-
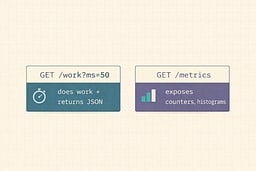
GET /work?ms=50
Simulates "doing work" by waitingmsmilliseconds, then returning JSON. It's intentionally simple so we can focus on the metrics, not the business logic. -
GET /metrics
Exposes Prometheus-style metrics so we can compute QPS/TPS/Concurrency/RT. This is the endpoint that makes everything else possible.
What we measure
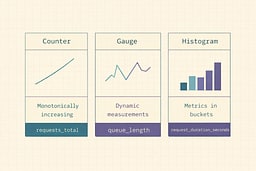
Use a minimal, universal metric set:
http_requests_total{route,method,status}(counter)http_request_duration_seconds_bucket{route,method,...}(histogram)http_in_flight_requests{route}(gauge)
Histograms are the standard way to measure latency distributions in Prometheus-land. They're like a histogram in statistics class, except these buckets actually matter for your on-call rotation.
If you use OpenTelemetry, align with semantic conventions for HTTP metrics (names/attributes), so tools agree on what your numbers mean. It's like speaking the same language—you can still communicate if everyone uses different words, but it's a lot harder.
Load testing: measure from the outside first (k6)
Install k6, then run this script. k6 thinks in "virtual users" and scenarios; it's intentionally simple so you can reproduce results. No more "it works on my machine" when it comes to load testing.
import http from 'k6/http';
import { sleep } from 'k6';

export const options = {
  scenarios: {
    steady: {
      executor: 'constant-vus',
      vus: 50,
      duration: '30s',
    },
  },
  thresholds: {
    http_req_failed: ['rate<0.01'], // <1% errors
    http_req_duration: ['p(95)<500'], // p95 < 500ms (example target)
  },
};

export default function () {
  http.get('http://localhost:8080/work?ms=50');
  sleep(0.1);
}
This script maintains 50 virtual users, each making requests every 100ms. It's like having 50 people constantly pressing the elevator button. The thresholds tell k6 to fail the test if error rate exceeds 1% or if p95 latency exceeds 500ms. It's your automated quality gate.
Prometheus queries that turn raw metrics into the four numbers
Assume you scrape /metrics into Prometheus. These queries transform raw counters and histograms into the four numbers that matter.
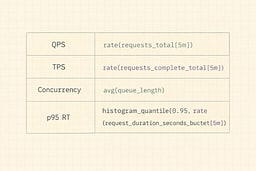
QPS (requests in)
sum(rate(http_requests_total[1m]))
This calculates the rate of change of the counter over a 1-minute window. It's like measuring how many cars pass a checkpoint per minute.
TPS (completed successful "transactions")
If your "transaction" is "HTTP 2xx response from /work":
sum(rate(http_requests_total{route="/work",status=~"2.."}[1m]))
The status=~"2.." regex matches any 2xx status code. This filters out errors and timeouts, giving you only successful completions.
(If your business transaction spans multiple HTTP requests, emit a separate transactions_total counter from your app. Don't try to derive business logic from HTTP requests—it's like trying to understand a conversation by counting words.)
Concurrency (in-flight right now)
sum(http_in_flight_requests)
This is a gauge, so no rate() needed. It's the current value, right now. Like checking how many people are currently in the elevator.
Response Time (p95)
histogram_quantile(
  0.95,
  sum(rate(http_request_duration_seconds_bucket{route="/work"}[5m])) by (le)
)
This is the magic query. histogram_quantile takes your histogram buckets and calculates the 95th percentile. The by (le) groups by the "less than or equal" bucket boundaries. It's like finding the point where 95% of your requests are faster.
Implementations in popular API stacks
These are intentionally "small." You can harden them later (timeouts, cancellations, graceful shutdown, etc.). Think of them as proof-of-concept code that shows you where the metrics go. Production code needs more, but this is where you start.
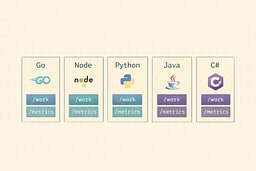
Go (net/http + Prometheus)
package main

import (
  "fmt"
  "net/http"
  "strconv"
  "time"

  "github.com/prometheus/client_golang/prometheus"
  "github.com/prometheus/client_golang/prometheus/promhttp"
)

var (
  inFlight = prometheus.NewGaugeVec(
    prometheus.GaugeOpts{Name: "http_in_flight_requests", Help: "In-flight requests"},
    []string{"route"},
  )
  reqs = prometheus.NewCounterVec(
    prometheus.CounterOpts{Name: "http_requests_total", Help: "Total HTTP requests"},
    []string{"route", "method", "status"},
  )
  dur = prometheus.NewHistogramVec(
    prometheus.HistogramOpts{
      Name:    "http_request_duration_seconds",
      Help:    "HTTP request duration (seconds)",
      Buckets: prometheus.DefBuckets,
    },
    []string{"route", "method"},
  )
)

func main() {
  prometheus.MustRegister(inFlight, reqs, dur)

  http.Handle("/metrics", promhttp.Handler())

  http.HandleFunc("/work", func(w http.ResponseWriter, r *http.Request) {
    route := "/work"
    inFlight.WithLabelValues(route).Inc()
    start := time.Now()

    ms, _ := strconv.Atoi(r.URL.Query().Get("ms"))
    if ms <= 0 {
      ms = 50
    }
    time.Sleep(time.Duration(ms) * time.Millisecond)

    w.Header().Set("Content-Type", "application/json")
    w.WriteHeader(http.StatusOK)
    fmt.Fprintf(w, `{"ok":true,"ms":%d}`, ms)

    dur.WithLabelValues(route, r.Method).Observe(time.Since(start).Seconds())
    reqs.WithLabelValues(route, r.Method, "200").Inc()
    inFlight.WithLabelValues(route).Dec()
  })

  http.ListenAndServe(":8080", nil)
}
Go's Prometheus client is straightforward: create your metrics, register them, then increment/observe/decrement as requests flow through. The WithLabelValues calls add dimensions to your metrics—route, method, status. These labels let you slice and dice your data later.
Node.js (Express + prom-client)
import express from 'express';
import client from 'prom-client';

const app = express();

const inFlight = new client.Gauge({
  name: 'http_in_flight_requests',
  help: 'In-flight requests',
  labelNames: ['route'],
});
const reqs = new client.Counter({
  name: 'http_requests_total',
  help: 'Total HTTP requests',
  labelNames: ['route', 'method', 'status'],
});
const dur = new client.Histogram({
  name: 'http_request_duration_seconds',
  help: 'HTTP request duration (seconds)',
  labelNames: ['route', 'method'],
  buckets: [0.01, 0.025, 0.05, 0.1, 0.25, 0.5, 1, 2, 5],
});

app.get('/metrics', async (req, res) => {
  res.set('Content-Type', client.register.contentType);
  res.send(await client.register.metrics());
});

app.get('/work', async (req, res) => {
  const route = '/work';
  const method = req.method;
  inFlight.labels(route).inc();
  const end = dur.labels(route, method).startTimer();

  const ms = Math.max(parseInt(req.query.ms || '50', 10), 1);
  await new Promise(r => setTimeout(r, ms));

  res.json({ ok: true, ms });

  end();
  reqs.labels(route, method, '200').inc();
  inFlight.labels(route).dec();
});

app.listen(8080);
The startTimer() method is convenient—it returns a function that, when called, records the duration. It's like a stopwatch that automatically logs to your histogram when you stop it.
Python (FastAPI + prometheus_client)
from fastapi import FastAPI, Response
from prometheus_client import Counter, Gauge, Histogram, generate_latest, CONTENT_TYPE_LATEST
import time

app = FastAPI()

in_flight = Gauge("http_in_flight_requests", "In-flight requests", ["route"])
reqs = Counter("http_requests_total", "Total HTTP requests", ["route", "method", "status"])
dur = Histogram("http_request_duration_seconds", "HTTP request duration (seconds)", ["route", "method"])

@app.get("/metrics")
def metrics():
    return Response(generate_latest(), media_type=CONTENT_TYPE_LATEST)

@app.get("/work")
def work(ms: int = 50):
    route = "/work"
    method = "GET"
    in_flight.labels(route).inc()
    start = time.time()

    if ms <= 0:
        ms = 50
    time.sleep(ms / 1000.0)

    dur.labels(route, method).observe(time.time() - start)
    reqs.labels(route, method, "200").inc()
    in_flight.labels(route).dec()
    return {"ok": True, "ms": ms}
FastAPI's type hints make the endpoint parameters clean, and prometheus_client follows the same patterns as the other languages. Python's time.time() gives you seconds since epoch, which matches Prometheus's expectation of seconds.
Java (Spring Boot + Actuator + Micrometer Prometheus)
Spring Boot makes this almost boring (good). You wire Prometheus once and get timers/counters. It's like having a car that tells you your speed, RPM, and fuel level without you having to install separate gauges.
Gradle deps (conceptual):
spring-boot-starter-webspring-boot-starter-actuatormicrometer-registry-prometheus
Expose metrics at /actuator/prometheus, then add a filter for in-flight if you want that explicit gauge. Spring Boot's auto-configuration handles most of the heavy lifting—you just need to enable the actuator endpoint and add the Prometheus registry.
C# (ASP.NET Core + prometheus-net)
Same story: middleware + /metrics.
- Package:
prometheus-net.AspNetCore - Add middleware to capture durations and in-flight gauge per route.
ASP.NET Core's middleware pipeline makes it straightforward to add metrics at the framework level, so every request automatically gets measured. It's like having a speed camera on every road—you don't have to remember to measure, it just happens.
(If you want, Part 2 will include full "real" code for Java + C# with routing labels done safely, because cardinality will happily ruin your day. Too many unique label combinations, and Prometheus will eat your memory like a black hole.)
How to improve each metric (without lying to yourself)
Improve Response Time (RT)
RT is usually killed by:
- slow downstream calls (DB, cache, third-party APIs)
- lock contention
- GC pressure / allocations
- serialization overhead / payload size
- missing timeouts (requests pile up forever)
Fixes that work:
- add strict timeouts + cancellation
- use connection pooling properly (DB + HTTP)
- cache what's expensive and stable
- reduce payload size (and stop shipping entire objects "just in case")
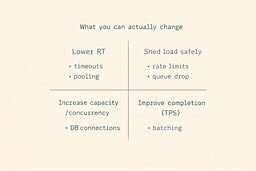
Improve Concurrency (handle more simultaneous work)
Concurrency ceilings are often:
- thread pools
- DB connections
- CPU cores
- open file descriptors
- queue depth
Fixes that work:
- async IO (where it matters)
- right-size pools (and cap them)
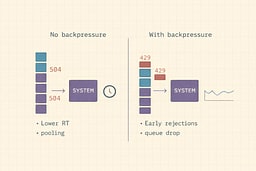
- backpressure: reject early instead of timing out late
- bulkheads: isolate critical routes
Backpressure is the difference between a system that gracefully degrades and one that falls over. It's like a restaurant that stops taking reservations when full, instead of letting everyone in and then having them wait forever for a table that never opens.
Improve QPS (accept more incoming pressure)
You don't "improve QPS" directly. You either:
- scale out (more instances)
- reduce per-request cost (RT down)
- shed load (rate limit, queue, degrade)
QPS is a measure of demand, not a knob you turn. You can't make more people press the elevator button—you can only make the elevator faster or add more elevators.
Improve TPS (complete more real work)
TPS goes up when:
- you eliminate retries/timeouts
- you reduce transaction cost (fewer DB round trips, better queries)
- you batch and pipeline work
- you make failure fast and explicit
TPS is the metric that matters for business outcomes. QPS tells you how busy you are. TPS tells you how much work you're actually getting done. It's the difference between looking busy and being productive.
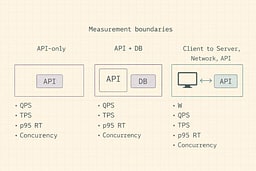
Common trap: you can't optimize what you didn't define
Decide what boundary you're measuring:
- If your "system" is the API server only, QPS = incoming HTTP rate.
- If your "system" is "API + DB," your throughput is limited by DB concurrency and query time.
- If your "system" includes clients, you must measure from the client too.
Little's Law works when you define the box you're measuring. It's like the Heisenberg uncertainty principle, but for performance—you can't measure everything precisely unless you define what "everything" means.
References
[1] Little, John D.C. "A Proof for the Queuing Formula: L = λW." Operations Research, Vol. 9, No. 3, 1961
[2] Google SRE Book. "Site Reliability Engineering: How Google Runs Production Systems." O'Reilly Media, 2016
[3] OpenTelemetry. "HTTP Semantic Conventions." OpenTelemetry Specification
[4] Prometheus. "Histograms and Summaries." Prometheus Documentation
[5] k6. "k6 Documentation: Virtual Users and Scenarios." Grafana Labs
[6] Beyer, Betsy, et al. "The Site Reliability Workbook: Practical Ways to Implement SRE." O'Reilly Media, 2018
[7] Humble, Jez, and Gene Kim. "The Phoenix Project: A Novel About IT, DevOps, and Helping Your Business Win." IT Revolution, 2013
[8] Kleppmann, Martin. "Designing Data-Intensive Applications: The Big Ideas Behind Reliable, Scalable, and Maintainable Systems." O'Reilly Media, 2017
[9] Prometheus. "PromQL (Prometheus Query Language)." Prometheus Documentation

About Joshua Morris
Joshua is a software engineer focused on building practical systems and explaining complex ideas clearly.